Category Archives: Discrete Mathematics

Boston Marathon Times

This morning thousands and thousands of people did something I can not even imagine doing . . . they ran the Boston Marathon (It was actually 35,671 entrants to be exact)!

This year the winning men’s time was 2:08:37 (Meb Keflezighi from California) . . . that’s an average speed of about 1 mile every 4.88 minutes.  (As a comparison I re-started Couch-to-5K last night . . . and I ran about 1 mile every 11 minutes).

Anyway, the whole Boston Marathon thing got me thinking . . . I wonder how Meb’s time compares to other people who have won the Boston Marathon?

The first Boston Marathon was run in 1917.  John J. McDermott (NY) won that race with a time of 2:55:10.  He was still averaging about 1 mile every almost 7 minutes.  So, is Meb just exceptionally fast?  Was John just exceptionally slow?

4.21.14

The graph above represents all of the Boston Marathon times–from John to Meb and all of the marathoners in between.  What do the data seem to tell you?  Was John exceptionally slow?  What about Meb?

Averagetime

This shows the average time for 10 year time spans of Boston Marathon winners.  What seems to be happening to marathon times-over time?

If you had to model Boston Marathon winning times, based on the number of years since the first marathon what type of model would you use?  Exponential Growth/Decay?  Linear Increase/Decrease?  Quadratic model?  Why?  Do you think there might be anything noteworthy about the graph as people continue running the marathon?  Will anyone ever run the marathon in under 2 hours?  1 hour? (if someone ran a marathon in under an hour they would be averaging 1 mile approximately every 2.25 minutes)

I’d love to know what you think!  In the meantime . . . I’ll be trying to get under the 10 minute mile mark with my Couch-to-5k app!

Happy Valentine’s Day 143

1 4 5 11

Do you?

It just makes me think of Valentine’s Day.  As a little kid I remember getting them from my parents, in their little cardboard box.  In high school, I used to tell my sweetheart of the month that all I wanted for Valentine’s Day was one of those little boxes . . . forget the flowers and stuffed bears!

What’s that you say?  You don’t know what 1 4 5 11 means?  It’s code.  1 4 5 11 is code for I love Necco Sweethearts.  You know those chalky little hearts with the Valentine sayings on them?  I didn’t make up this code, Necco did.  Have you seen these hearts?

Screen Shot 2014-02-13 at 1.38.46 PM

(Find the top 14 conversation hearts here, including 143).

Do you know what 143 stands for?  I (1) love (4) you (3).  Get?  If not don’t feel bad.  This person Facebooked Necco to find out why in the world she ate a heart with 143 on it!

Screen Shot 2014-02-13 at 1.28.35 PM


Screen Shot 2014-02-13 at 1.28.49 PM

Anyway, I think its cute and all but as far as codes go . . . its really not that great.  I mean 143 could stand for lots of things couldn’t it?

But here’s the thing, Necco’s touching on something that mathematicians have used for a long time.  That is, numbers as code for something else.  Try this one:

91215225251521.

OK, OK.  So its not that hard, right?

Its either:

IABAEBBEBEAEBA or ILOVEYOU.  I’m not sure that I would want to send some sort of top secret code through cyberspace if my coding technique was A=1, B=2, C=3, etc.  But what about this code?

4560776126257605

Do you want a hint?  OK.  It looks like that number might be divisible by 5.  Oh!  It is divisible by 5.  I wonder what you get when you divide the number by 5?

Hmm.  We might be on to something.  It seems to me that a great way to code something might be to do the whole A=1, B=2, C=3 thing and then to multiply it by another number.  If the person I’m sending the code to knows the number to divide my code by, the code is pretty darn easy for the receiver to crack and its fairly difficult for a spy to intercept and figure out what it says, don’t you think?

So, find a sweetheart and send them something in code for tomorrow.  My sweetheart is getting this message.  Can you crack it?

22125135191513519235520851182019

Math Dice Game

My mom bought me this little game called “Math Dice” for Christmas this year.  Have you heard of it?  I hadn’t, and truth be told, I’m not sure my mom realized it was a game she was buying it for me.

photo 1 copy

When I opened the package she said “I thought you could do something creative with those dice and your math blog.”  In the days after Christmas, I scooped the unopened box of dice into our “junk drawer” (sorry mom) and rediscovered them this weekend while cleaning.  On the back the of the box were the directions to the “Math Dice Game.”

photo 2 copy

This morning I had a little extra time, so I thought I’d give the game try!

Step One: Roll the 12-sided target dice

photo 3

Step Two: Roll the three 6-sided scoring dice.  Combine the three scoring dice in anyway to match or come closest to the Target Number.

photo[3]

Ummm, really?  1, 1, 2?  The closest I could get to 80 was 24.  This is what I did:

(1+1+2)! = 4*3*2*1.  Can you get closer?

My second roll of the Target Dice was 36

My Scoring Dice roll was 6, 4, 2

Super easy: (6*(4+2))=36.  Did you get 36 another way?

My last roll was 20

And my scoring dice were 6, 3, 1

I couldn’t get 20.  I could get 18 and 21, but 20 right on the money was a little tricky.  Can you do it?

Much, much more to come about this fun Math Game, with my new Math Dice . . . I’m working on a table of possible Target Number combinations as we speak!

Math for High Ability Learners–at the University of Iowa

Just a quick note to let you know that I’m teaching Math for High Ability Learners, a 3 week virtual workshop offered at the University of Iowa beginning January 21.  The workshop is worth 1-hour of graduate or undergraduate credit from the University of Iowa.

To register for the course click here.

The focus of the course will be designing mathematics lessons to meet the needs of both the typical and the high-ability learners in K-12 mathematics classrooms.

To get a better idea of the coursework here’s the syllabus:

MHAL Spring 14–Syllabus.

I hope you’ll join me!


M&M’s Revisited (for the Last Time!)

If you haven’t been here before, then you don’t know that we’ve already talked about M&M’s twice (here and here) and you don’t know that we’ve talked a little bit about the colors of M&M’s in the bags.

Well, today I want to keep talking about the different colors of M&M’s in the bags.  Except today I want to talk about the percent of M&M’s that are red, orange, yellow, green, blue, brown.  Before we continue our M&M discussion, do you have a guess?   That is, what percent of the M&M’s manufactured are red, orange, yellow, green, blue, brown?

Hmmm . . . Let’s pretend that we don’t know (maybe you really don’t!).  I think a pretty educated guess would be that 16.67% of the M&M’s are red, 16.67% of them are orange, 16.67% yellow, etc., etc.  Can you live with that guess?

I’m going to use the data I collected in my last M&M post, except instead of individual bags I’m going to look at my entire sample of M&M’s.

Here’s the percentage breakdown of M&M’s:

Screen Shot 2013-11-26 at 9.52.31 AM

Let’s make a nice table, based on what I would expect to get, given my educated guess of 16.67% of each color and what I actually got:

Screen Shot 2013-11-26 at 9.52.41 AM

So, I wonder if the distribution of colors I got in my sample would be likely, if the colors of M&M’s really were distributed evenly at the manufacturer?

Luckily for us there’s a statistical test we can use to answer that exact question.  And, luckily for us its a pretty straightforward test to understand!  It’s called the Chi-Square Goodness of Fit Test.  The Chi-Square Goodness of Fit test compares the observed values (in our case my M&M colors) to the expected values (if our initial assumption was true).  In our case we would subtract the expected value from the observed value and square the difference.  Then, we would divide by the expected value.  We’d do this for each color of M&M and add up the results.  Don’t worry, I’ll do it (actually, I did it with the help of this website). . .

Based on the Chi-Square Goodness of Fit Test it’s fairly reasonable to assume that I could have gotten this distribution of M&M colors given the fact that M&M Mars makes 16.67% of each color of M&M’s.

Screen Shot 2013-11-26 at 10.10.29 AM

So, here’s my next question?  Do they?

(So here’s the thing, about 5 years ago the M&M Mars website used to answer this exact question, but in 2008 they stopped.  This person wrote to M&M’s and posted the response)

Use the distribution for Milk Chocolate M&Ms detailed by M&M Mars and run another Chi Square Goodness of Fit Test with my data (or your own, if you collected any).  How does this compare to the 16.67% guess?


Reblogged from The Atlantic: The Myth of I’m Bad at Math

Today I’m reblogging a post I saw in The Atlantic this morning.  I’m reblogging it because I think the authors, Miles Kimball and Noah Smith, do a great job of articulating a sentiment that I think many, many mathematics teachers share.

(And because they talk about Terence Tao, and any true Math Warriors fan knows his importance in the world of mathematics!)

Enjoy.


And the Winner is . . .

So, did you see that last week some lucky person in South Carolina won the $400 million Powerball Jackpot? (Technically, it was $399.8 million, but $400 million is close enough!)

It seems like every time there’s a big jackpot won in the lottery you read statements like “you’re more likely to be struck by lightening,” or “you’re more likely to marry a prince,” or in the case of the CNN story about this particular Powerball winner “you’re more likely to get struck by lightening and bitten by a shark.” (Talk about a bad day!)  They also go an to say that the chances of winning a Powerball Jackpot are 1 in 175223510.  Don’t you wonder how people come up with all of these statistics?

Let’s take a look at how Powerball is played . . .

According to the Powerball website, lottery numbers are drawn from two drums.  The first drum contains 59 white balls and the second drum contains 35 red balls (These red balls are all potential Powerballs).  The jackpot is won by matching all five white balls in any order and the red Powerball.

In order to calculate the odds of winning, we need to figure out the odds of matching all five white balls, in any order, and the red ball.

Let’s start with the white balls:

I like to think about situations like the one described above by picturing an empty (in this case) lottery ticket.  Like this:

Screen Shot 2013-09-24 at 8.56.35 AM

The first ball that pops up could be any of the 59 balls, the second ball could be any of the 58 balls, the remaining blank spots on the ticket will be filled by drawing from the final 57, 56, and 55 balls respectively.

That looks like this:

Screen Shot 2013-09-24 at 8.58.23 AM

Now, the order doesn’t matter in the way I arrange the balls, remember?  That means if the winning white balls are 1, 2, 3, 4, 5 and my ticket is 2, 3, 4, 1, 5; I’m on my way to winning the Powerball!  So now we need to figure out how many different ways the 5 white ball numbers can be arranged.

The first white number could be any of the 5 numbers drawn from the drum, so I have 5 choices for the number in the first spot.  I only have 4 remaining numbers for the second spot, 3 for the 3rd spot, etc . . .

Because I can rearrange the numbers and still have a winning ticket, the possible number combinations I need to win has just been decreased!  Now, we can calculate the number of ways to get a winning combination from the white balls in the Powerball drawing:

The total number of combinations is :

Screen Shot 2013-09-24 at 9.05.05 AM


And now for the red Powerball!  The process we used above is going to be the same for red Powerball, except instead of having to match 5 numbers you only have to match 1 and because there’s only one number to be matched it doesn’t really make sense to talk about whether or not the order matters . . . there’s only one number.

Since you know a method to use and you know the answer, I’m pretty confident you are going to be able to figure how CNN could report that a person has a 1 in 175223510 chance in winning.

Good Luck!

P.S. I used a few different techniques from Discrete Mathematics or Counting Theory in this post that I didn’t explicitly name.  First, as in the case of the white lotto balls I was choosing 5 balls from a collection of 59 balls.  The order in which I arranged these 5 balls was not important.  This situation describes a combination or a binomial coefficient.  There is a formula associated with these types of situations.  We used this formula, although I did lots of canceling to make the numbers used look less overwhelming.  You could rewrite the situation that I described above as a combination using the formula provided from the combination link and see if you can get it to look like the one I used.

Also, we calculated the factorial of 5, denoted 5!.  If you attempt the challenge I’ve given you above, you’ll want to make sure you know what a factorial is.

Talking the Talk and Walking the (Math) Walk

A few days ago I was poking around my alma mater’s website (Go Panthers!) and came across this math walk:

unimathwalk

(This math walk was originally posted at: http://www.uni.edu/math/sites/default/files/pdfs/unimathwalk.pdf )

I thought it was such a cool idea that I wanted to create a math walk of my own!  (So I did).

I know that not all of you will be walking around Iowa City or The University of Iowa’s campus, so I thought I’d bring the math walk to you.  I’d encourage you to:

1. Try my virtual math walk

and then . . .

2. Get some friends, or a class, or your family and create a math walk of your own.  When you do, send it to me (katherine-degner@uiowa.edu) and I’ll post the math walks on my blog.  Soon no one will be able to walk around without “thinking math.”  Wouldn’t that be great!

My University of Iowa/Iowa City Math Walk

I work at the Belin-Blank Center, on the University of Iowa Campus . . . which is here:

Screen Shot 2013-09-03 at 11.43.32 AM

So, I headed out of the building toward the Pentacrest (more on that later) and the Old Capital.

photo1

I got no more than half a block when I ran in to this!

photo[6]

The official name of the sculpture is “Ridge and Furrow,” although many people at the University of Iowa refer to it as the “brain sculpture.” (For obvious reasons!).   It was carved by artist Peter Randall-Page.  The artist says that it is many up of one, continuous ridge flanked by v-shaped furrows.

1. The description made me think of the mobius strip.  In other words, think of this as one great big twisty infinity symbol (which is a mobius strip, just FYI).  I’m also wondering if we could cut the continuous ridge and stretch it out into a straight line, how long would it be?  How could you estimate this?

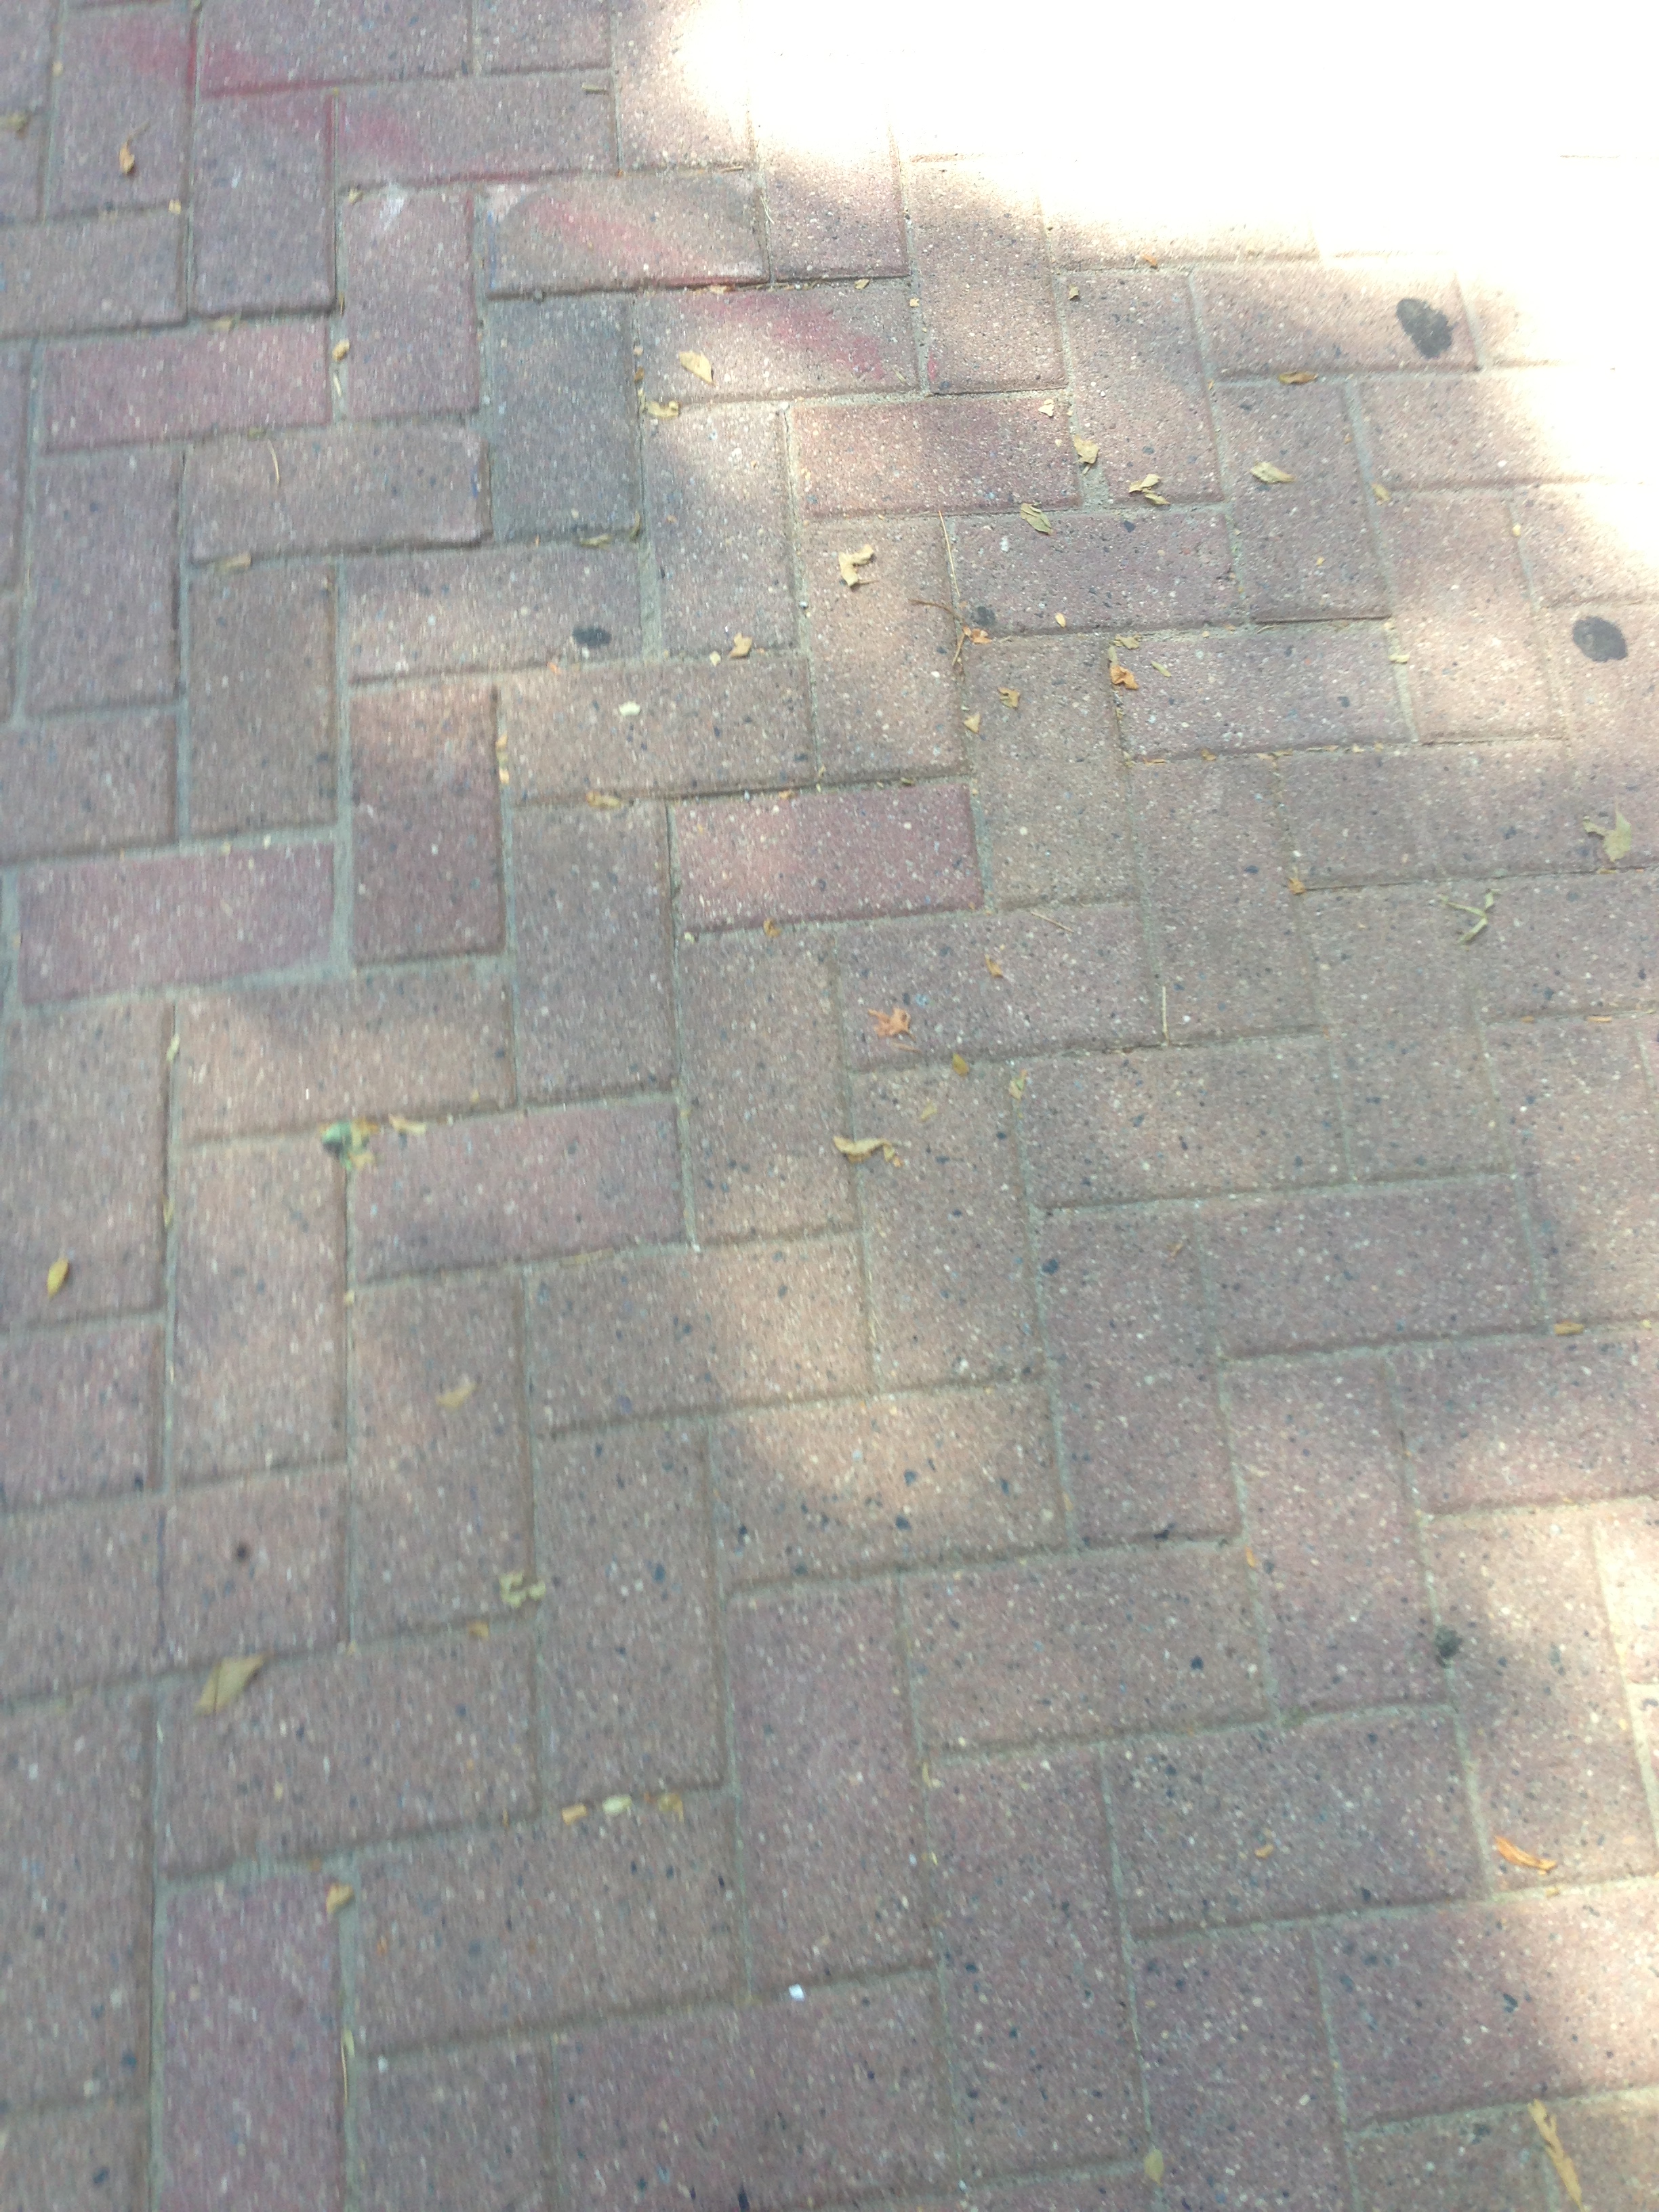
As I headed toward the Pentacrest, I couldn’t help but notice the bricks I was walking on.

They looked like this.  I also noticed they tessellated the plane.

photo

2. Which made me wonder, how many other ways could I arrange these standard sized bricks so that they would continue to tessellate the plane?  And, what wallpaper pattern does this tessellation belong to?  Which really asks, “What type of symmetry is being used to create this pattern?”

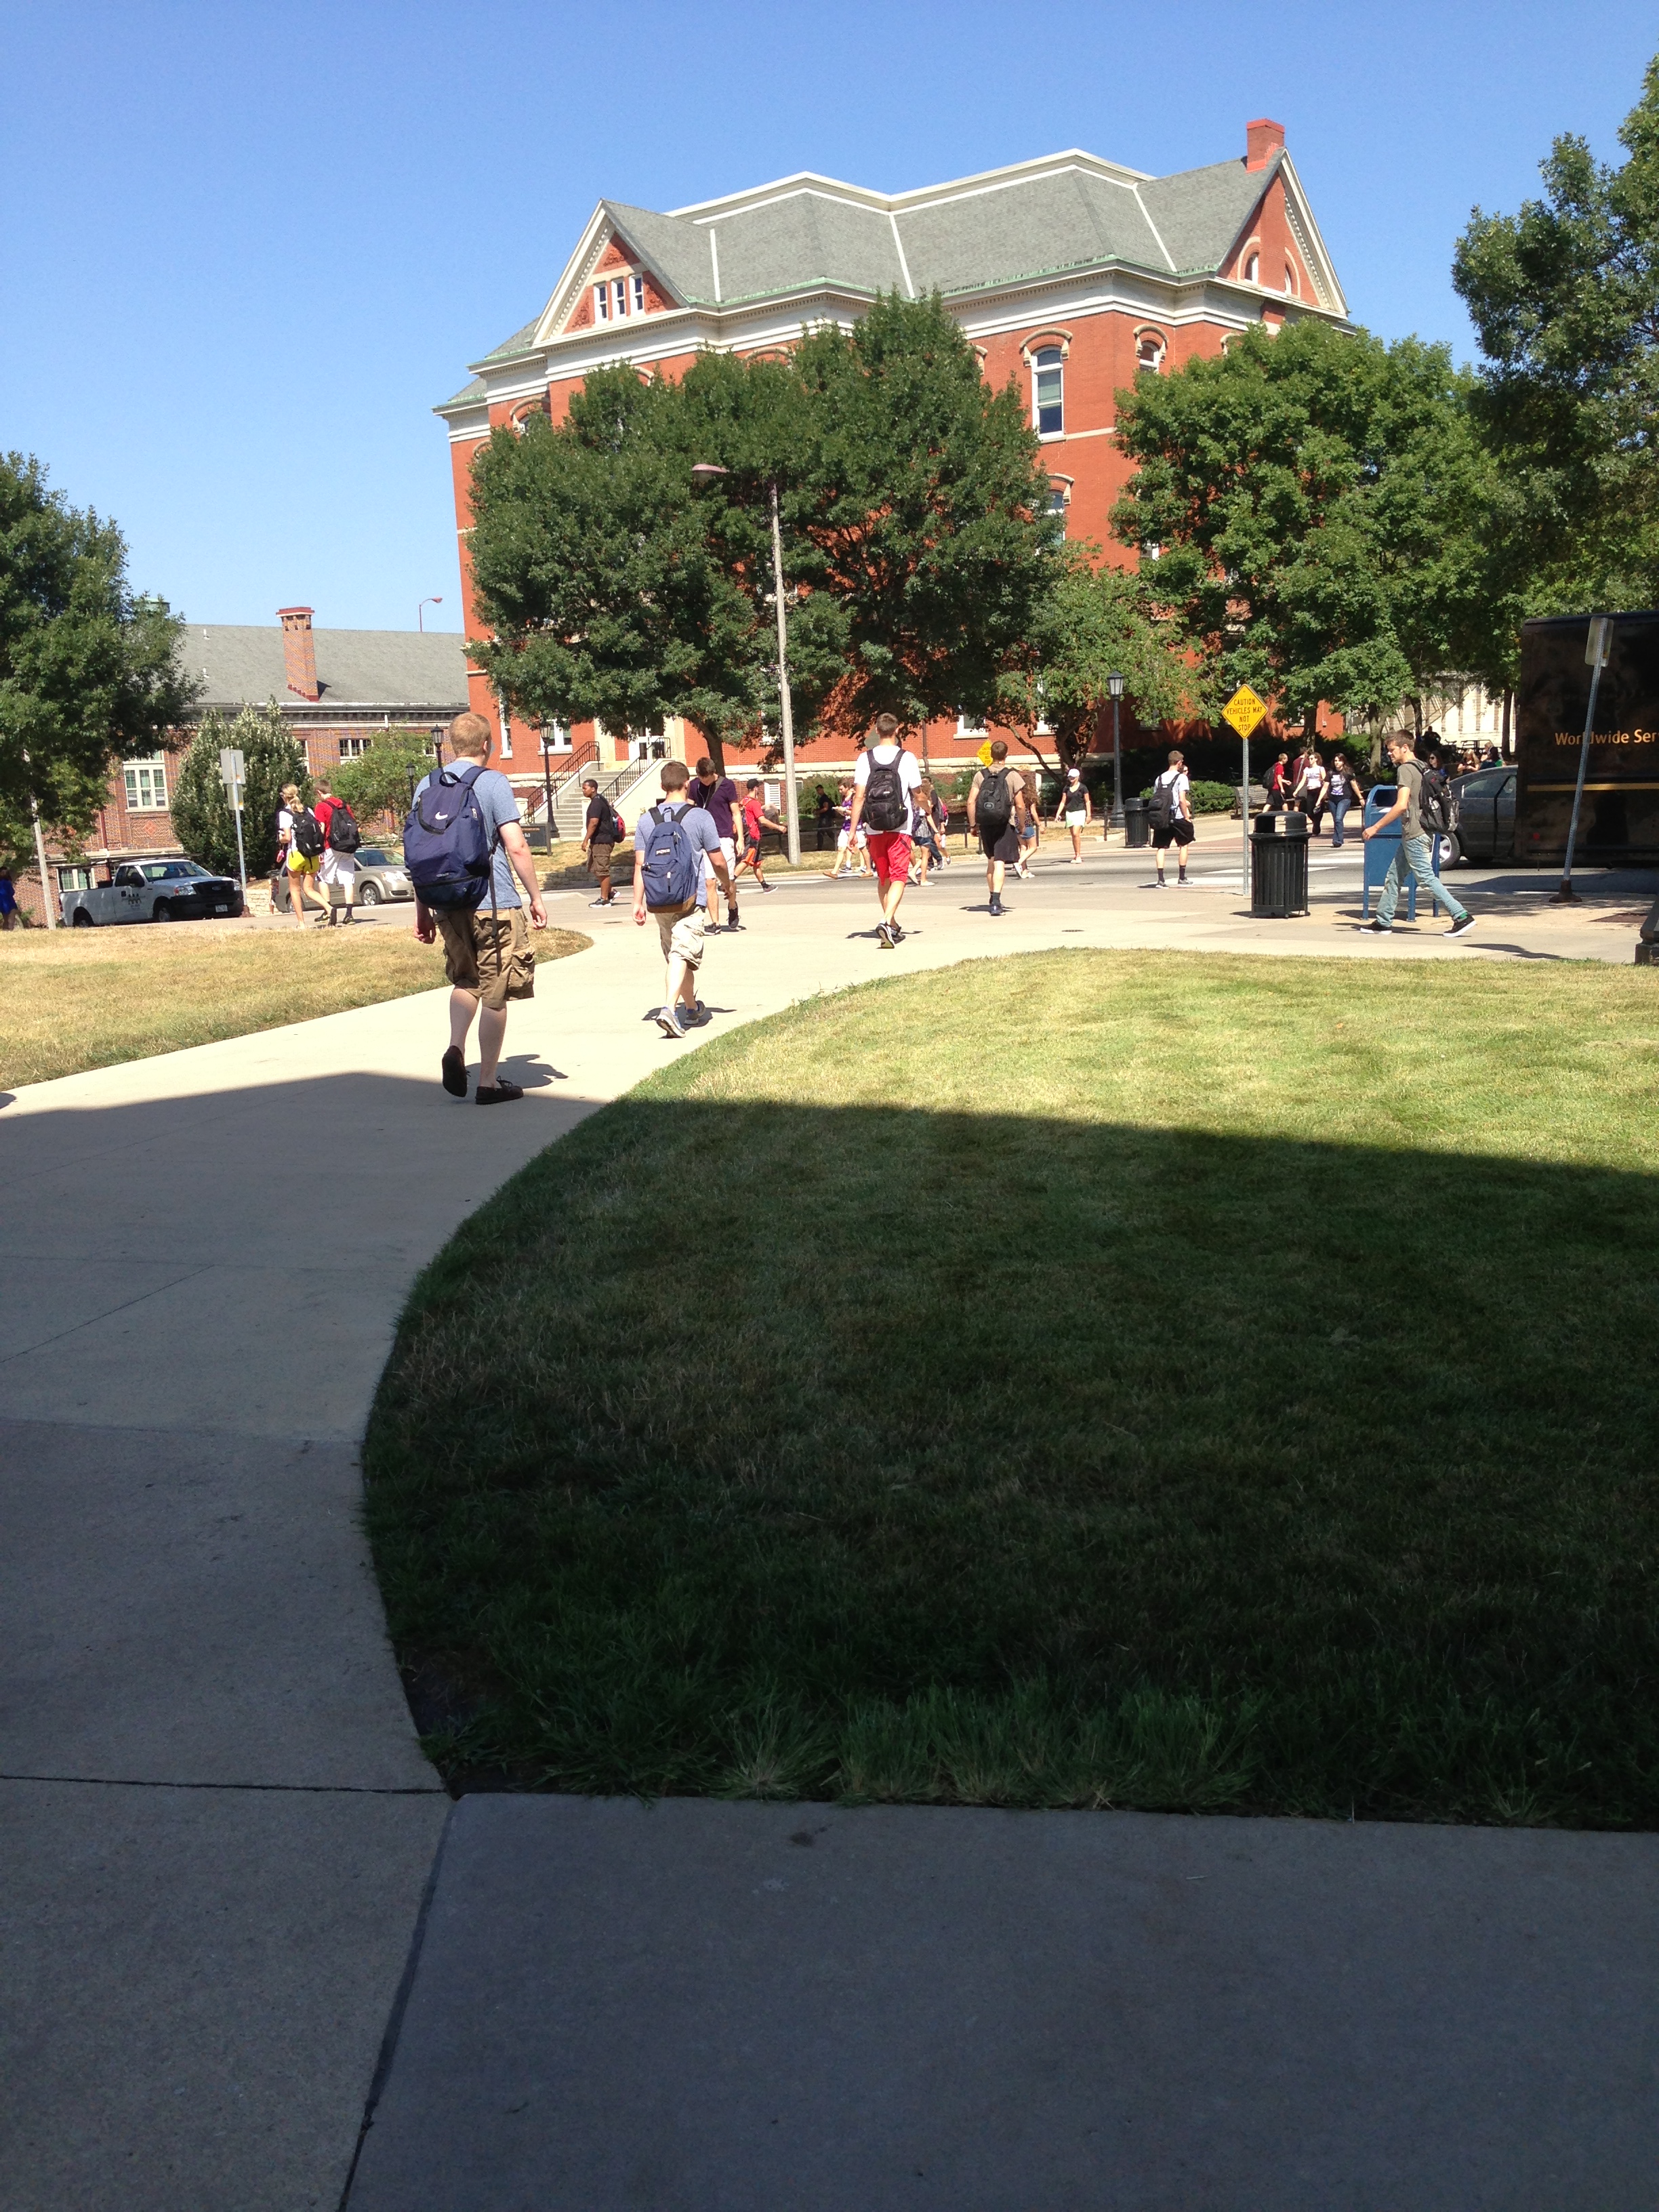
In the middle of my math walk many classes let out and I was flooded by students.  And I saw these two:

photo2

3. Which made me wonder, what are the chances of that happening?  (In case you can’t tell from the picture, the two men are dressed exactly.the.same. blue t-shirts, khaki shorts).  This question takes the form of “if you have 3 pairs of blue socks, and 2 pairs of green socks, what are the chances that . . .”

I was headed to the Pentacrest because I knew about a secret on the Pentacrest.  I thought I was the only one that knew, until I found this.   Anyway, “what’s the secret?” you might ask.  Well, the University of Iowa Pentacrest is home to the largest walnut tree in the state of Iowa!  Here it is:

photo3

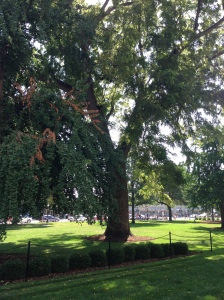
This leads me to my next (maybe obvious? question).

4. How tall is the tree and how in the world do you measure it?

As promised at the beginning of the post, I have a little bit more to tell you about the Pentacrest.  First, you may or may not know that penta- means 5.  This might lead you to believe that the Pentacrest has five buildings.  And if that’s where your thoughts lead you, you’d be right!  The Pentacrest is a little piece of lawn which houses 5 university buildings (one of which is the Old Capitol).  I tried to take a picture of the Pentacrest, but the truth is the professional photographers, that took ariel pictures just do a much better job.  See:

pentacrest_slideshow

Do you also see how it kind of looks like a pentagon?  No, not THE Pentagon (which is a regular pentagon), but it does kind of look like a pentagon, except that the Old Capital isn’t a vertex.  Anyway, this leads me to my last question on my math walk:

5. Is there a way to get to each of the 5 buildings using the sidewalks provided, such that I go to all buildings and walk on each sidewalk exactly once?  (Kind of reminds you of the Bridges of Konigsberg Problem, doesn’t it?)

Whew!  You made it!  Happy math walking!

P.S. Once I started “math walking” I just couldn’t stop, so I snapped these pictures as I was walking home from work:

photo5photo4

I’m wondering:

6. What percent of the house is covered in ivy?

7. Is that an equilateral triangle?  How could we find out?

30 Day Blogging Challenge

OK!  I’m doing it!  I’ve read about lots and lots of blogging challenges over the past few days and I’ve been trying to decide whether or not I want to try one.  And . . . I’m doing it!

(Thanks to The Nester and her blog post about her October 31 Day Challenge)

I’m going to be a mentor for the Student Blogging Challenge.  Just for fun, I’m also going to post each day for the month of September.  I’ll keep all things Student Blogging Challenge related on the 30 Day Blogging Challenge page, but I’ll reference it in some of my other blog posts also.

I hope you’ll join me!  What a fun way to start the school year!